How To Migrate from Qlik Sense to Tableau?
December 4, 2020
Networkdays Function Implementation In Tableau
December 4, 2020Dynamic drill down in Tableau :
Using Set Actions in tableau To implement dynamic drill-down for the number of dimensions and the user wants to be able to see its numbers at a high level but wants to retain the ability to dig deeper into the data for underperforming measures. For example – when the business user clicks on Level 1, the report column name further drills down and shows the division ‘level 2’ and from there it goes to level 3 and so on.
Challenges to User/Developer-
The above problem can be resolved with the help of a dynamic drill down cascading hierarchy using set actions.
Multiple Drill Down Using Set Actions in tableau:-
Level 1 Level 2 Level 3 Level 4 Level 5
Solution: Set Actions in tableau
Approach-
Set Actions in tableau: Drill down allows users to explore multidimensional data by navigating from one level down to a more detailed level. This allows users to view aggregated, summary data and then hierarchically explore deeper levels of the data for more specific analysis
Technical Solution –
Step 1: HOW TO MAKE A DRILL DOWN REPORT:
In order to convert our normal tabular report into a drill-down report in Tableau, we need to write a lot of calculations. Follow along and you’ll be a drill-down Pro in no time at all.
[Level 1]
[Category]
Use the drop-down menu on the “Level 1” field under Dimensions on the data pane to select Create -> Set. Name the set Category Set.
In the resulting Create Set dialogue, under the General tab, check one or more values. This creates a fixed set. Choose any category to be a member of that set. The membership is temporary and will be overwritten by the set action because we will configure the set action
Problem Description-
To implement dynamic drill-down for a number of dimensions and users want to be able to see their numbers at a high level but wants to retain the ability to dig deeper into the data for underperforming measures. For example – when a business user clicks on Level 1, the report column name further drills down and shows the division ‘level 2’ and from there it goes to level 3 and so on.
Challenges to User/Developer-
Set Actions in tableau The above problem can be resolved with the help of a dynamic drill down cascading hierarchy using set actions.
Level 1 Level 2 Level 3 Level 4 Level 5
Solution
Approach-
Drill down allows users to explore multidimensional data by navigating from one level down to a more detailed level. This allows users to view aggregated, summary data and then hierarchically explore deeper levels of the data for more specific analysis
Technical Solution – Set Actions in tableau
Step 1: HOW TO MAKE A DRILL DOWN REPORT:
In order to convert our normal tabular report into a drill-down report in Tableau, we need to write a lot of calculations. Follow along and you’ll be a drill-down Pro in no time at all.
[Level 1]
[Category]
Set Actions in tableau Use the drop-down menu on the “Level 1” field under Dimensions on the data pane to select Create -> Set. Name the set Category Set.
In the resulting Create Set dialogue, under the General tab, check one or more values. This creates a fixed set. Choose any category to be a member of that set. The membership is temporary and will be overwritten by the set action because we will configure the set action to update the values momentarily.
[Level 2]
IF [Category Set] then” ↳” + [Sub-Category] END
Create a Sub-category set by using the Level 2
[Level 3]
IF [Category Set] and [Subcategory Set] then “↳” + [Manufacturer] END
Create a Manufacturer set by using the Level 3
[Level 4]
IF ([Category Set] and [Subcategory Set] and [Manufacturer Set]) then “↳” + [Product Name] END
Create a Product set by using Level 4
[Level 5]
IF ([Category Set] and [Subcategory Set] and [Manufacturer Set] and [Product Set]) then “↳” + [Customer Name] END
What are these calculations doing exactly? They are simply updating each set value based on user selection. In our level 5 calculation, it says if the mark or marks in the view is in the Category Set, subcategory set, Manufacturer set, and Product set, the calculation will return the Customer Name for that Product.
[Level No]
IIF(NOT ISNULL([Level 5]),5,
IIF(NOT ISNULL([Level 4]),4,
IIF(NOT ISNULL([Level 3]),3,
IIF(NOT ISNULL([Level 2]),2,1))))
The above calculation helps in identifying the maximum level based on user selection.
[Max Level]
{FIXED: MAX([Level No])}
Max Level helps in identifying the value of the maximum level in our dataset.
[Filter Excess Records]
[Level No]=[Max Level]
The next step is to compare the level with the maximum level in the data source. This restricts the display of multiple columns in our tabular data, so we created the Filter Excess Records
[Level Combined]
IF ([Category Set] and [Subcategory Set] and [Manufacture Set] and [Product Set]) then [Level 5]
ELSEIF ([Category Set] and [Subcategory Set] and [Manufacture Set]) then [Level 4]
ELSEIF [Category Set] and [Subcategory Set] then [Level 3]
ELSEIF [Category Set] then [Level 2]
ELSE [Level 1] END
Level combined gives us the exact Level value based on members of the Set.
[Level Header]
IF [Level Combined]=[Level 5] then [Category] + ” ” + ” ↳” + [Sub-Category]+ “” + ” ↳” + [Manufacturer]+ “” + ” ↳” + [Product Name]
ELSEIF [Level Combined]=[Level 4] then [Category] + “” + ” ↳” + [Sub-Category]+ “” + ” ↳” + [Manufacturer]
ELSEIF [Level Combined]=[Level 3] then [Category] + “” + ” ↳” + [Sub-Category]
ELSEIF [Level Combined]=[Level 2] then [Category]
ELSEIF [Level Combined]=[Level 1] then “Category” END
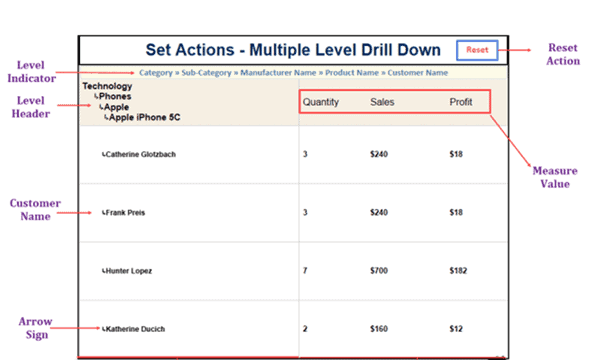
Level title indicates the user that they are currently in.
[Level Indicator]
IF [Level Combined Final]=[Level 5] THEN
“Category » Sub-Category » Manufacturer Name » Product Name » Customer Name”
ELSEIF [Level Combined Final]=[Level 4] THEN “Category » Sub-Category » Manufacturer Name » Product Name”
ELSEIF [Level Combined Final]=[Level 3] THEN “Category » Sub-Category » Manufacturer Name”
ELSEIF [Level Combined Final]=[Level 2] THEN “Category » Sub-Category”
ELSEIF [Level Combined Final]=[Level 1] THEN “Category” END
I think we have written enough calculations, it is time to implement each one of these based on our requirements.
STEP 2: BUILD THE VIEW
How to Set Actions in tableau :
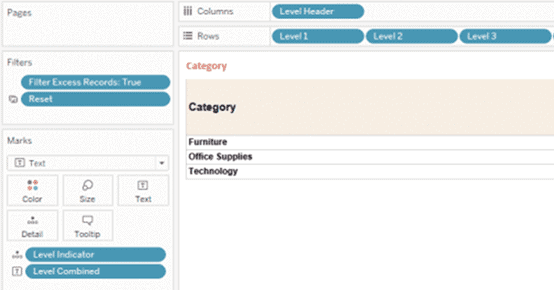
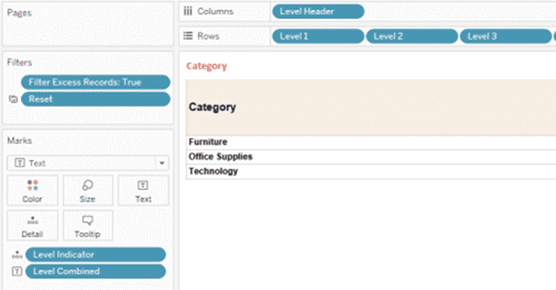
- Build the view by dragging the Level 1, level 2, Level 3, Level 4, Level 5 fields to Rows (in that order) and Level Header on columns.
- Uncheck the Show Header Option for each Level available on the Rows shelf.
- Drag Level Combined to Text in the Marks card.
- Add Filter Excess Records and Filter it for True.
- Add Filter Indicator to detail Shelf.
Table-Created-for-drill-down-view
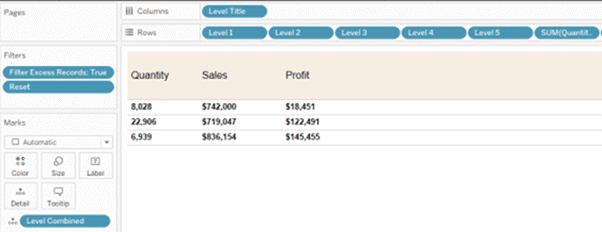
Create another sheet that contains all your measure values. In my example, I am using Quantity, Sales, and Profit. Add all the Levels on the worksheet like the one which you did earlier.
Table-that-contains-Measure-Values.
STEP 3: CREATE SET ACTION
After you create your worksheet, add both the sheets (Crosstab and Crosstab value) on your dashboard. You might need to resize and reorganize it to work better for your users. Make sure worksheets remains the same size, regardless of the size of the window used to display them.
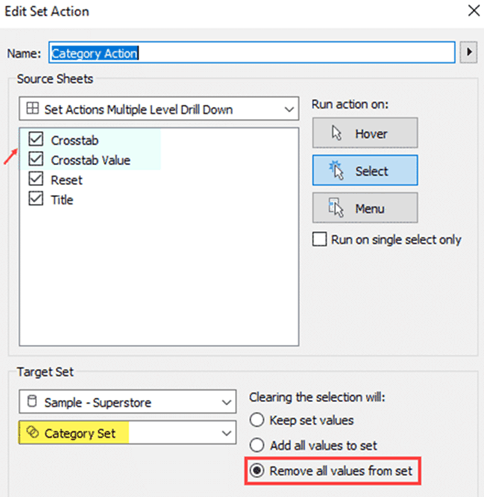
- Create a set action. On the Dashboard menu, select Actions.
- Click Add Action, and then select Change Set Values.
- Name the action as Category Action.
Select the following options:
Source Sheets: Make sure only the relevant sheets are selected.
Run action on: Choose Select. This will make the action apply when the user selects a mark or marks in the view.
- Target Set: Select the current data source from the first drop-down list and the Category set from the second drop-down list.
Clearing the selection: Select remove all values from the set.
Create-a-set-action
Similarly create set actions for Subcategory, Manufacturer, and Product name. The dashboard actions window should look like the below image.
Dashboard Action Window
STEP 4: DRILL DOWN IN USE
We are almost done with our requirements. Let us validate whether the table conditionally expands or not when a user clicks the marks. Based on user selection, the set action updates the selected dimension set with a single value.
Advantages-
Set actions combined with one Calculated Field enables us to add an interesting additional feature to an interactive dashboard that lets the user decide which hierarchy shall be shown in a view.
Conclusion-
When we are migrating from Qlik sense to Tableau above solution will be more effective, the dynamic drill-down hierarchy will be effective functionality in Qlik sense so it will be done easily following the above steps in Tableau.


